The U.S. Home Health Care and Personal Care Services sector represents one of the most structurally resilient and fastest-growing segments within the broader healthcare services landscape. Supported by aging demographics, strong preference for aging-in-place, and continued pressure on institutional healthcare systems, demand for home-based care is expected to accelerate materially over the next decade.
Despite regulatory headwinds and margin pressure driven by reimbursement compression, the sector continues to attract robust buyer interest from strategic consolidators, private equity platforms, and new industry entrants. Scale operators with diversified payer exposure, strong caregiver networks, and demonstrated operational excellence are achieving premium valuation multiples relative to smaller, more owner-dependent agencies.
For sellers, today’s environment presents a highly attractive exit window: demographic tailwinds and consolidation demand are colliding with increasing regulatory complexity that favors larger, more sophisticated providers. This dynamic is driving meaningful valuation dispersion between professionally managed agencies and those with concentrated referral sources or significant owner reliance.
Home health and personal care represent a large and expanding segment of the U.S. healthcare system. The industry includes skilled home health (Medicare-certified), personal care/private duty agencies, Medicaid waiver services, and hybrid operators.
The U.S. home healthcare sector is projected to grow significantly over the next decade. The chart below shows rising demand for home-based services and equipment, driven by demographic and payer-driven shifts across the healthcare system:

The industry remains highly fragmented, with the vast majority of operators generating under $2 million in annual revenue. This fragmentation has fueled a multi-year consolidation cycle, as buyers seek scale efficiencies, geographic diversification, and increased negotiating leverage with payers.
Industry revenue is projected to grow at roughly 5.7% annually over the coming years, outpacing historical growth of around 3.4%. Key long-term growth drivers include:
Across nearly every forecast, home-based care is viewed as one of the most sustainable and economically defensible segments of the healthcare system.
The U.S. is undergoing the most significant aging wave in modern history:
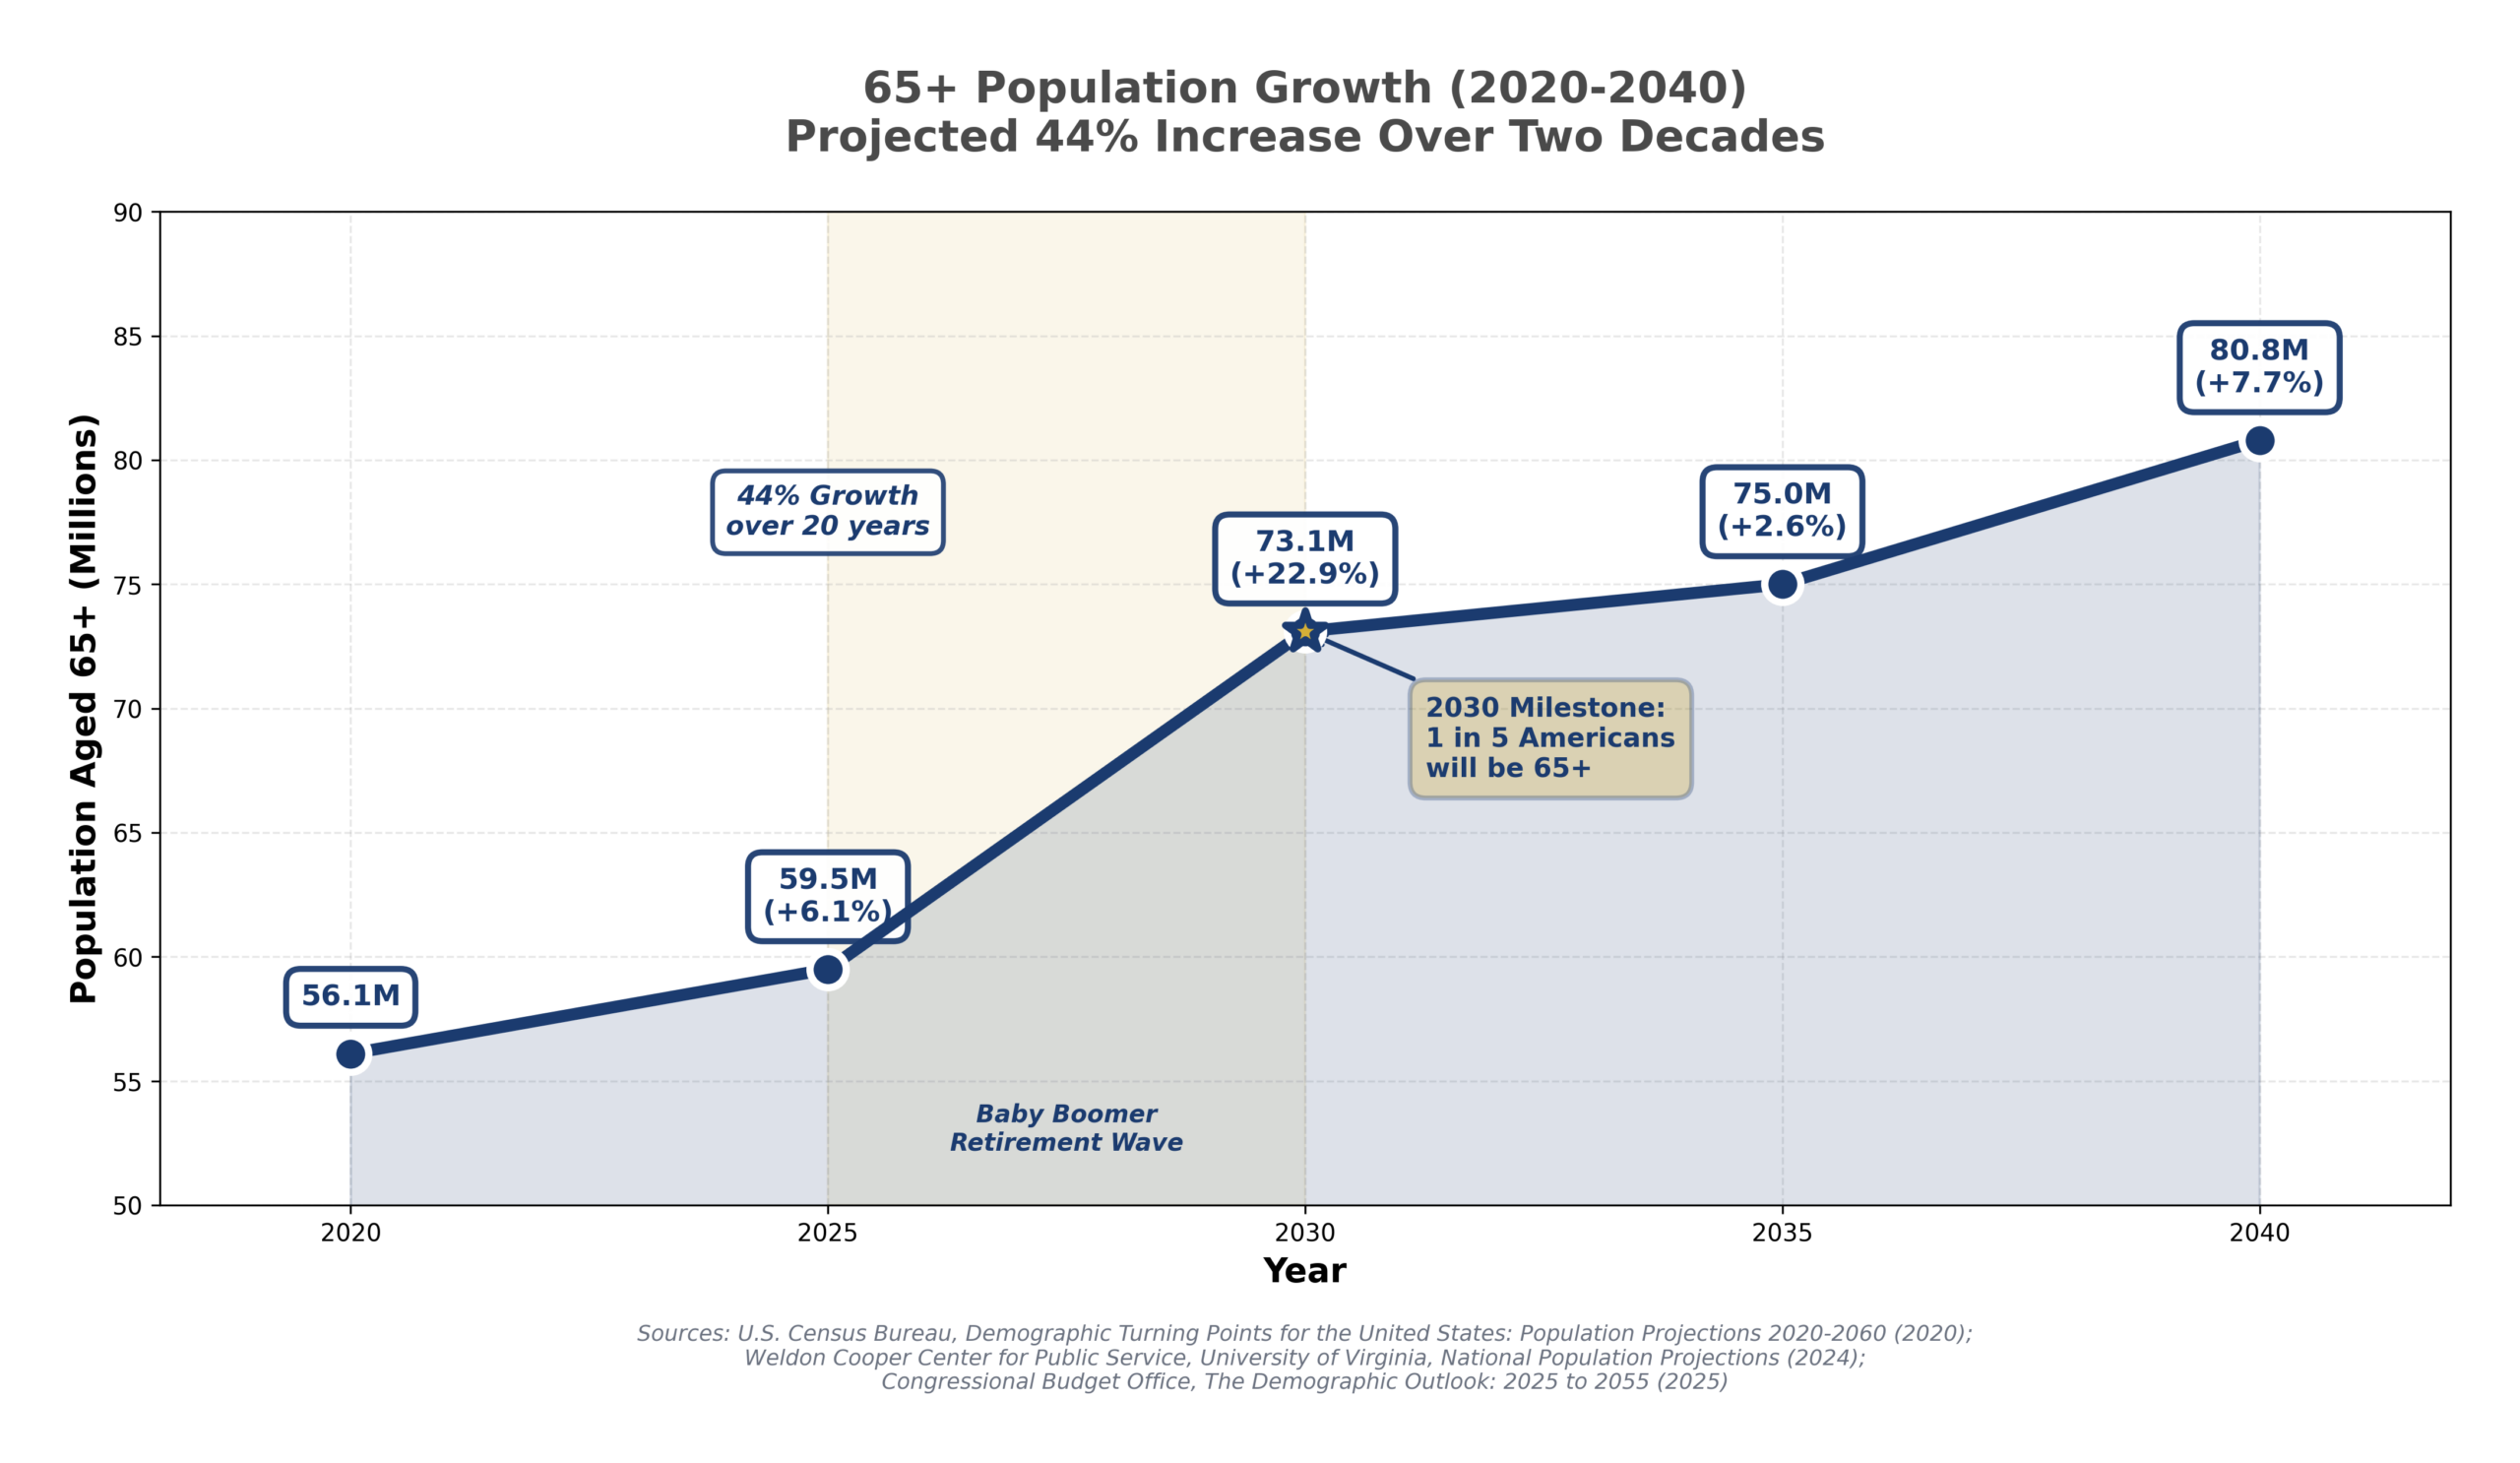
These structural demographic factors support long-term demand stability, largely independent of economic cycles.
Home care provides a compelling economic alternative:
This cost advantage is central to national healthcare strategy—providers are incentivized to shift care into the home.
While compliance burden remains high, policy direction favors the expansion of home-based care:
Margins in home care are primarily determined by labor costs, payer mix, and geographic wage conditions. Caregiver labor represents the single largest expense category, and wage inflation over the past decade has materially compressed margins for smaller operators.
Typical agency economics:
Margins vary significantly by:
Strong agencies typically demonstrate net margins at or above 15%, with Seller’s Discretionary Earnings (SDE) margins in the 15–20% range. A very high SDE margin (above 20%) may suggest understaffing, outsized owner involvement, or expenses being deferred.
Buyers focus heavily on whether margins are sustainable given wage inflation, payer mix, and staffing levels.
Caregiver wages have climbed substantially over the last decade. The charts below show how rising hourly pay and cumulative wage growth have materially increased labor costs for home care agencies over the past decade:

BRG
The chart below shows how valuation multiples differ across home care operator types, with skilled services and multi-state platforms achieving the highest EBITDA multiples:
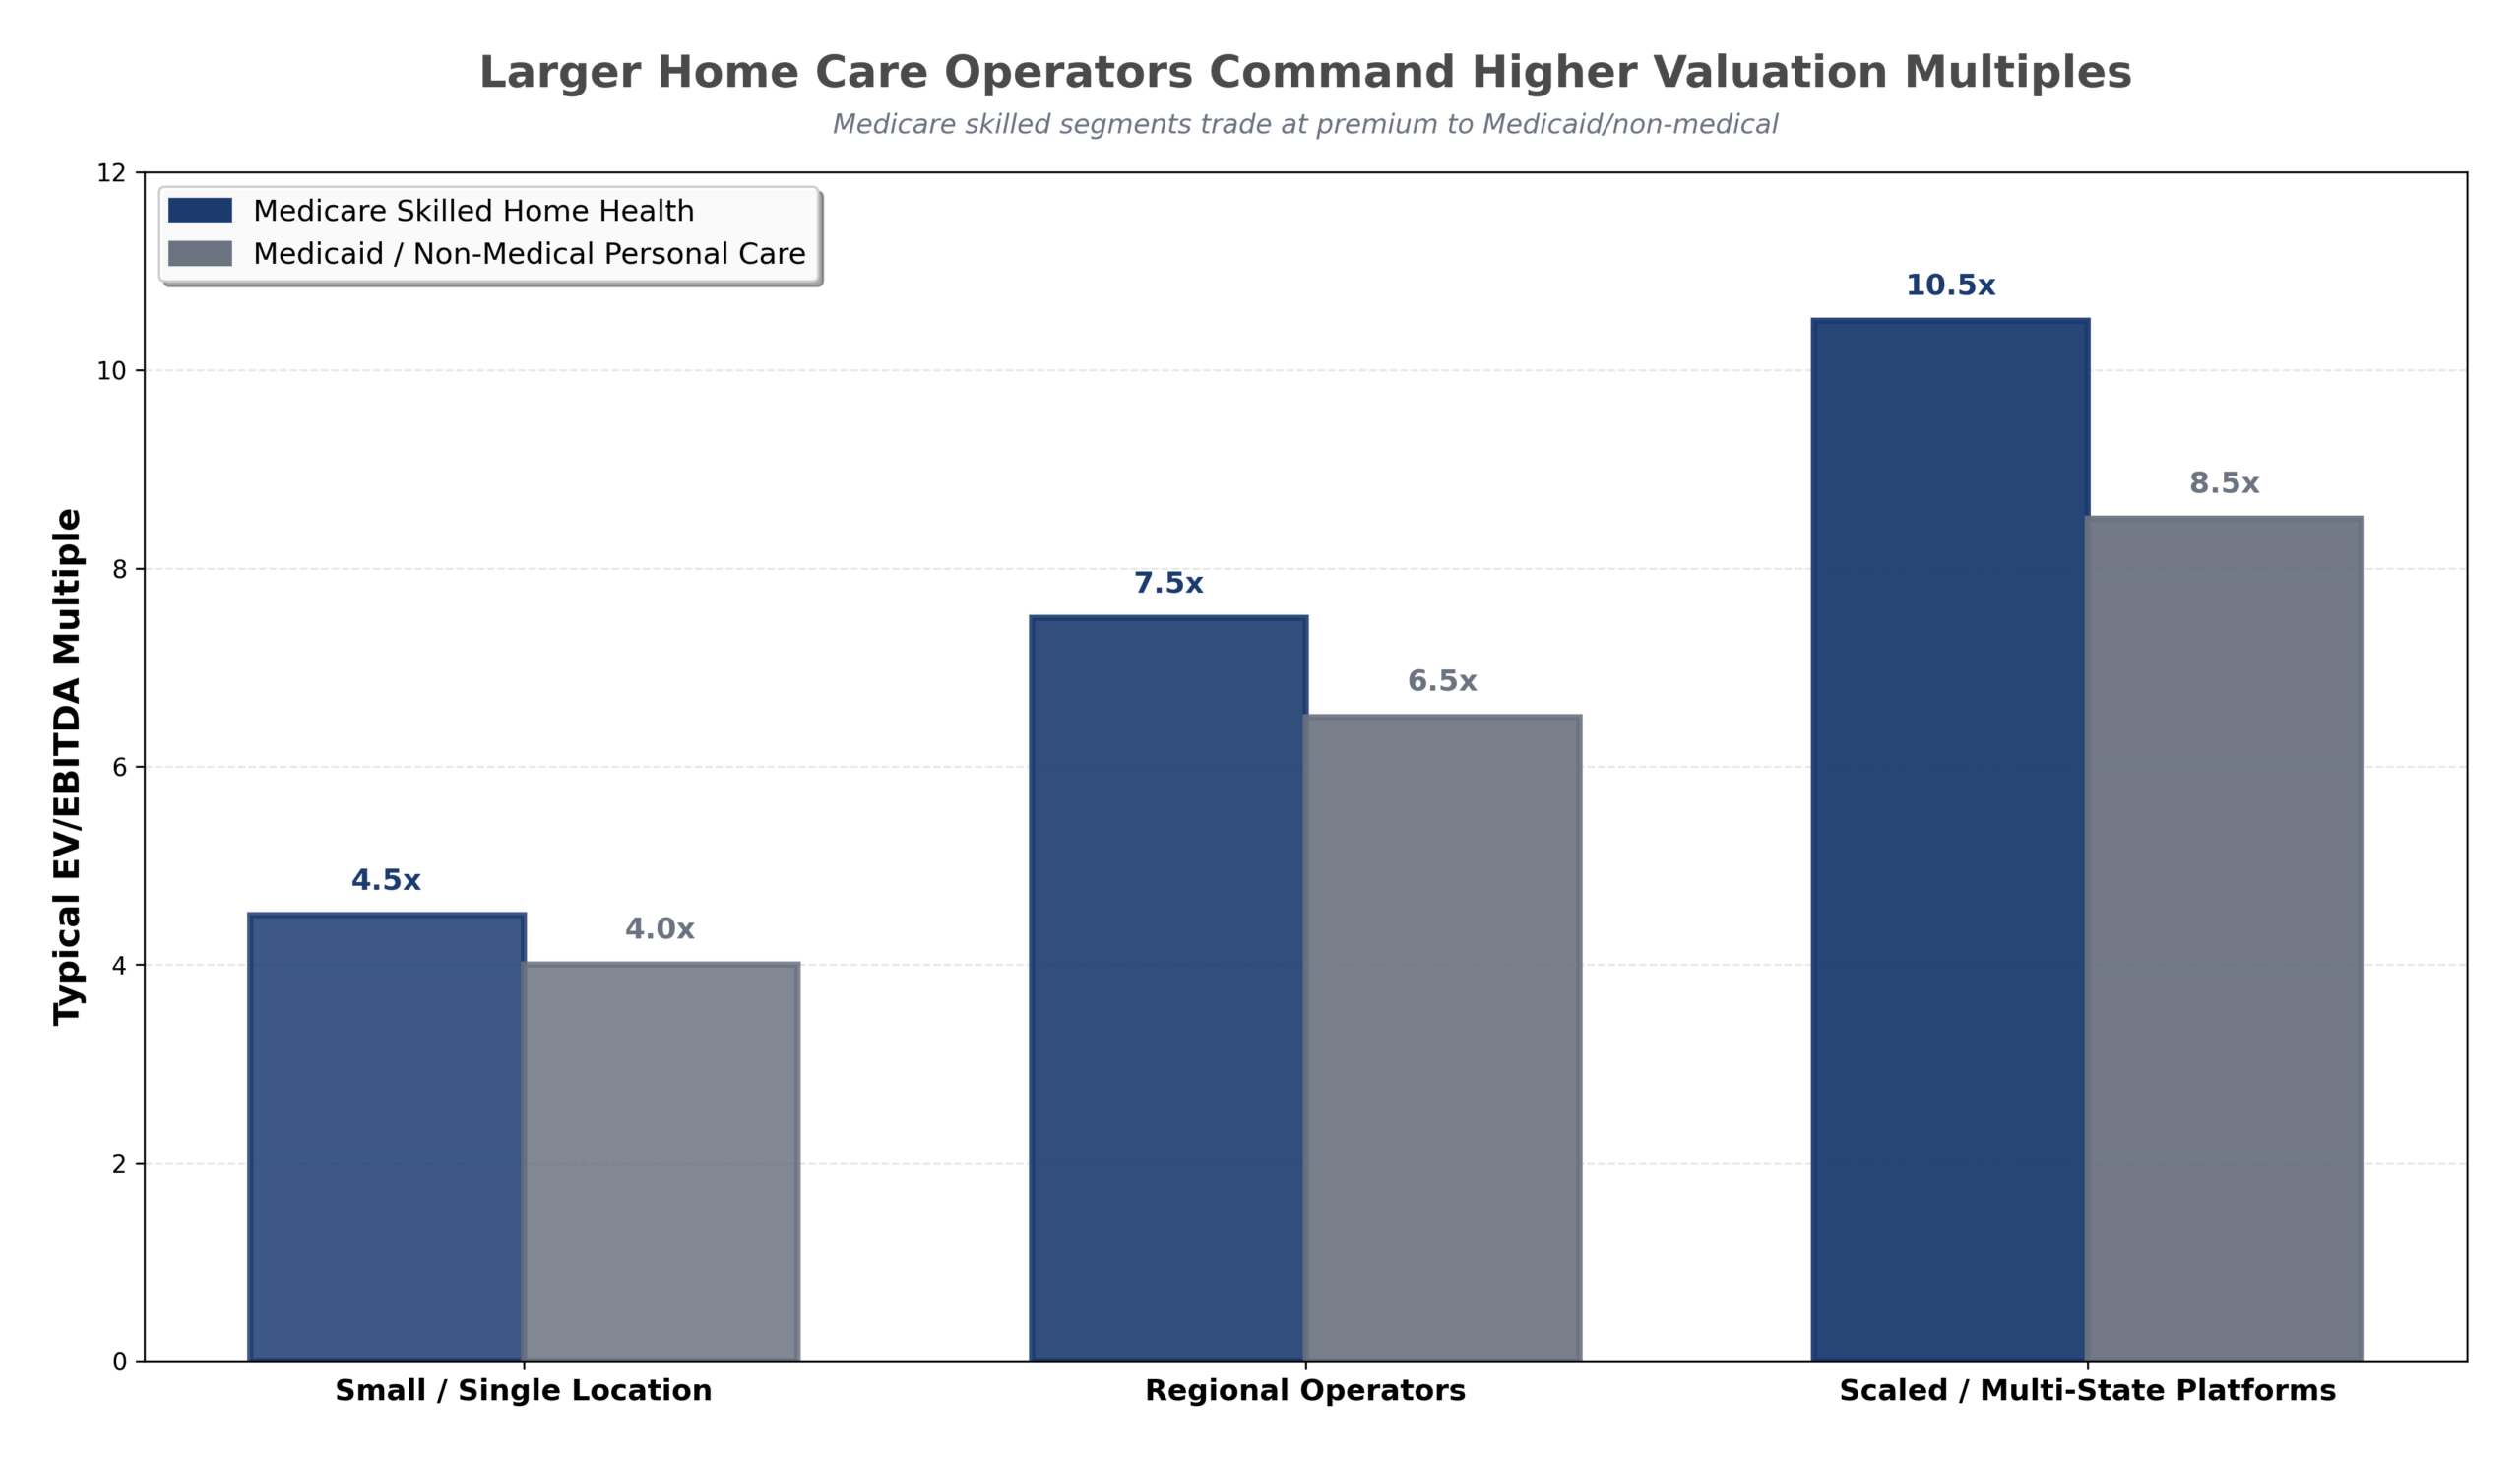
This comparison highlights the valuation disparity between smaller, owner-dependent agencies and scaled regional or multi-state operators. Smaller home health and personal care businesses typically trade at the low end of their ranges due to referral concentration, staffing instability, and limited payer diversification. In contrast, scaled platforms demonstrate stronger operational consistency, diversified referral bases, and more sustainable margins—supporting premium EBITDA multiples. This chart reinforces that buyer demand favors operational maturity and size.
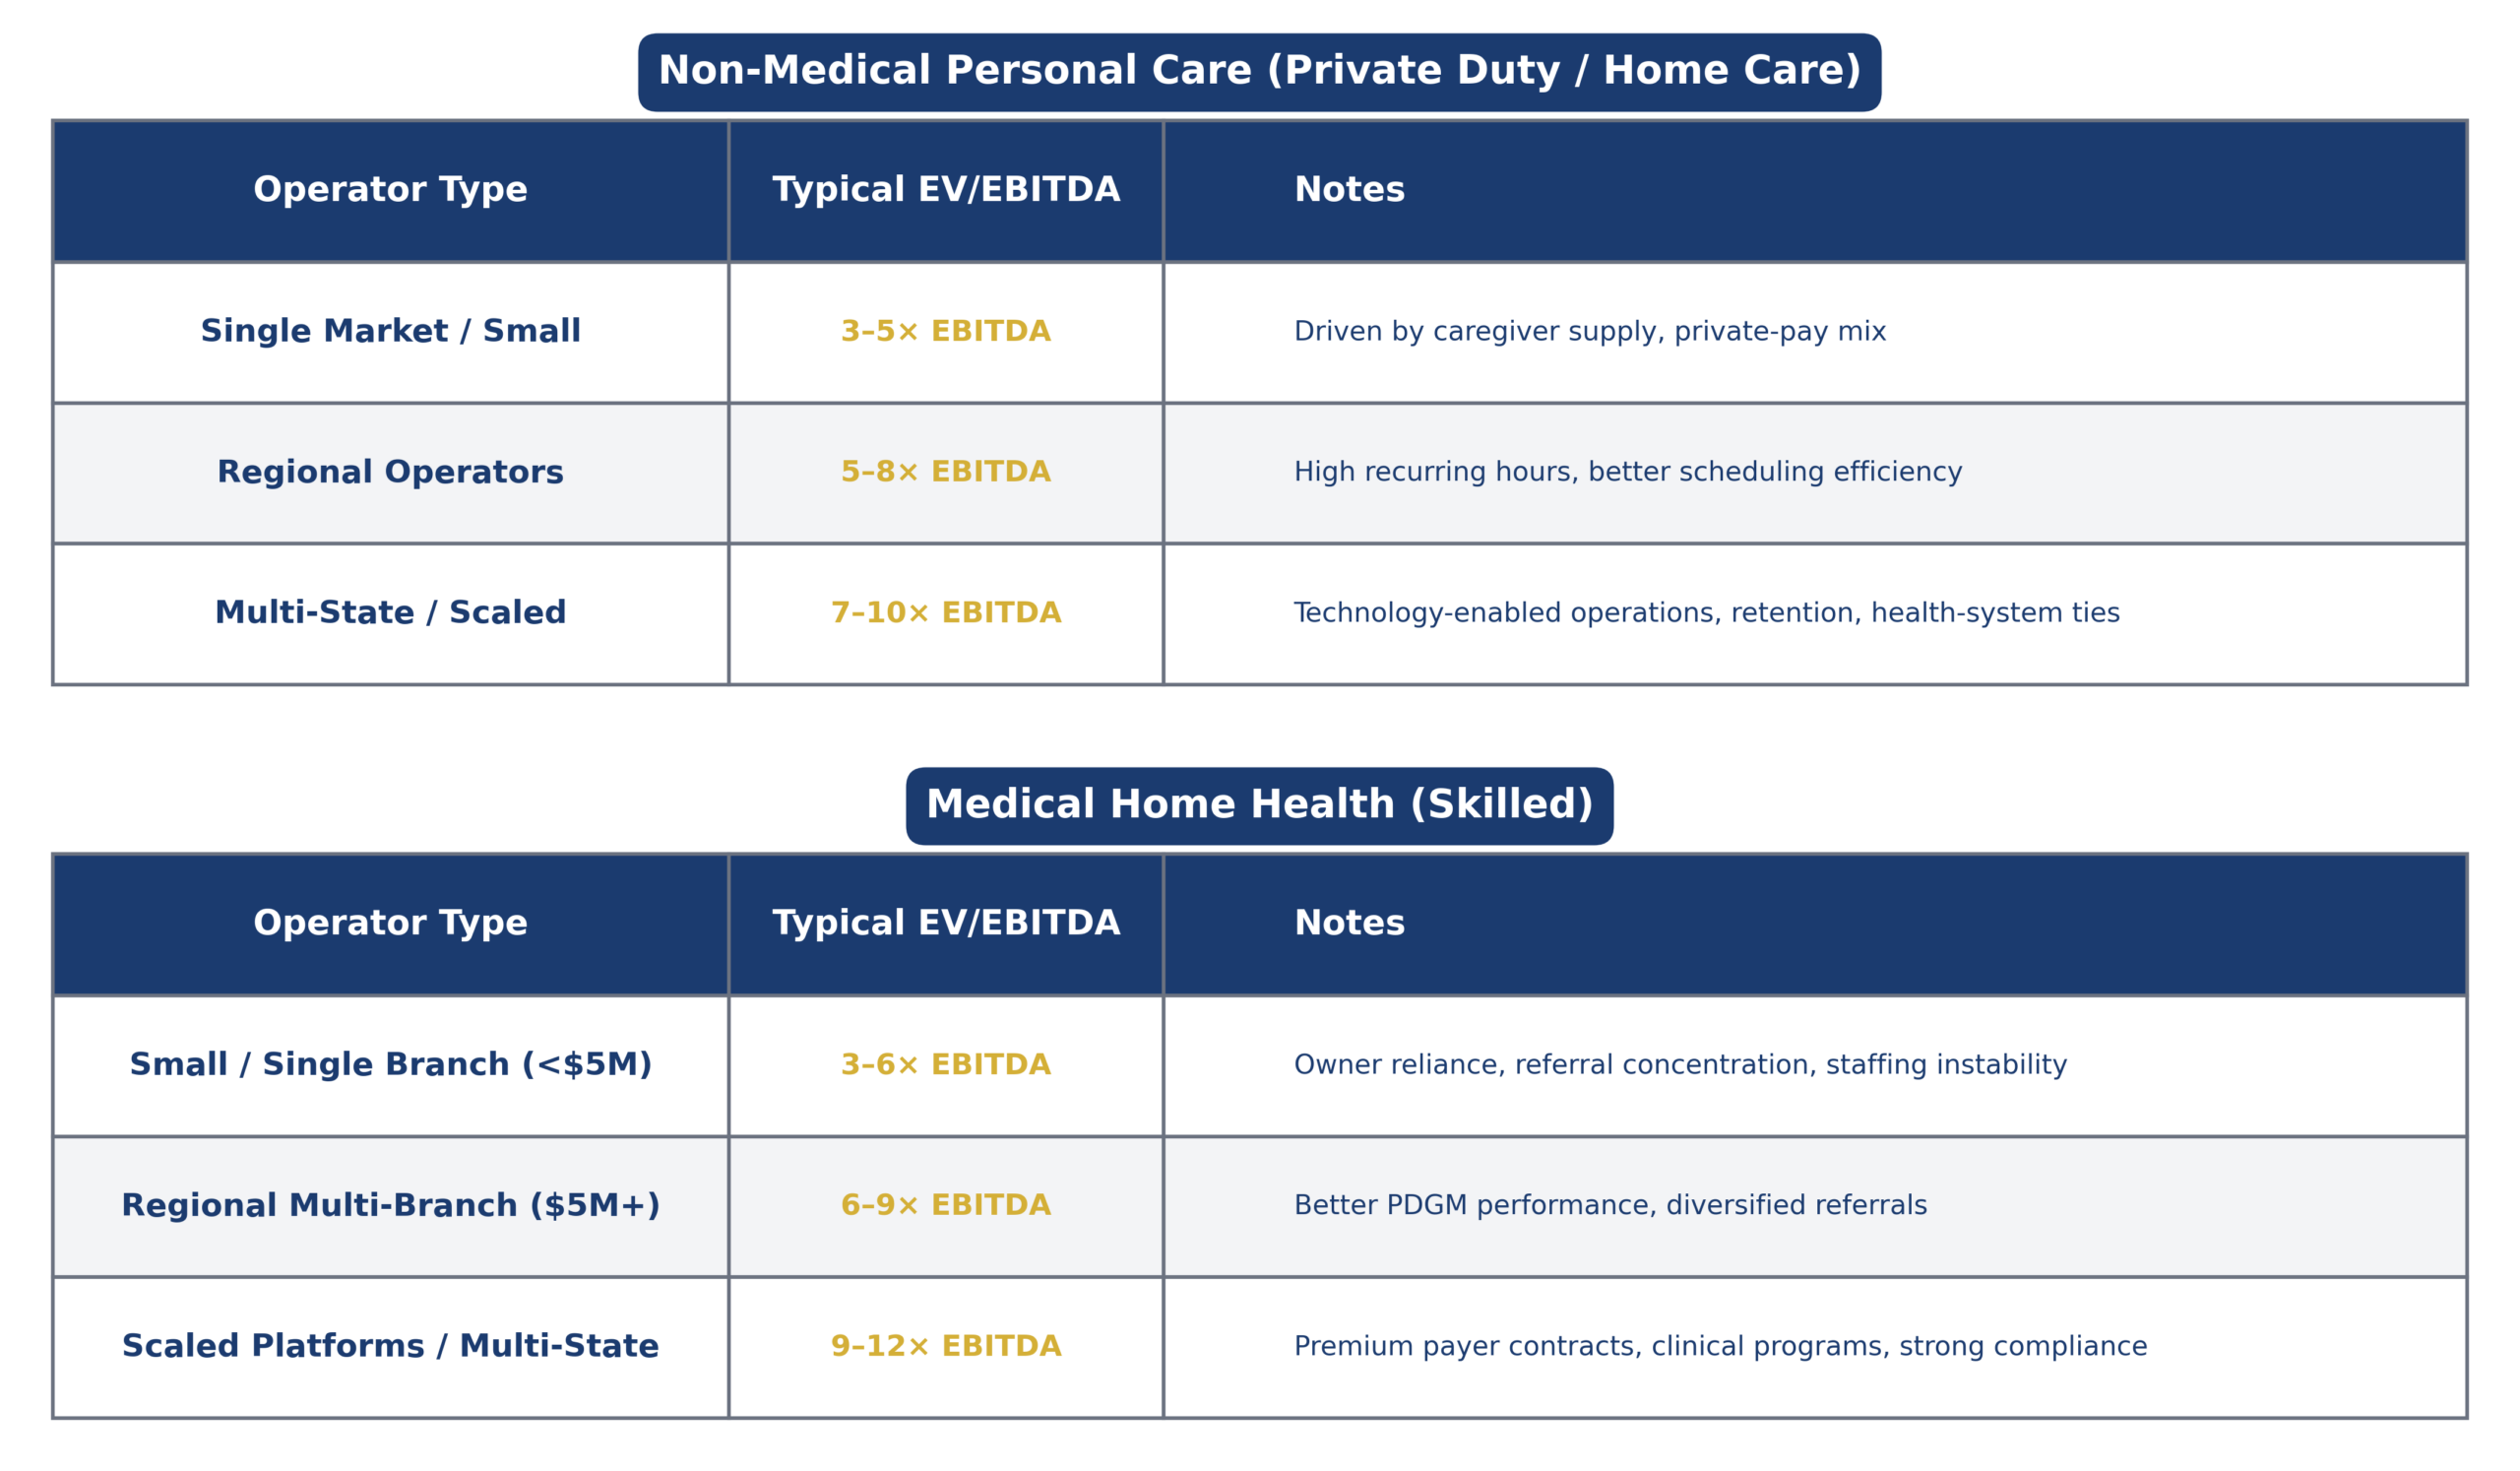
The table below provides the foundational “rules of thumb” that most buyers and lenders rely on when underwriting home care acquisitions.
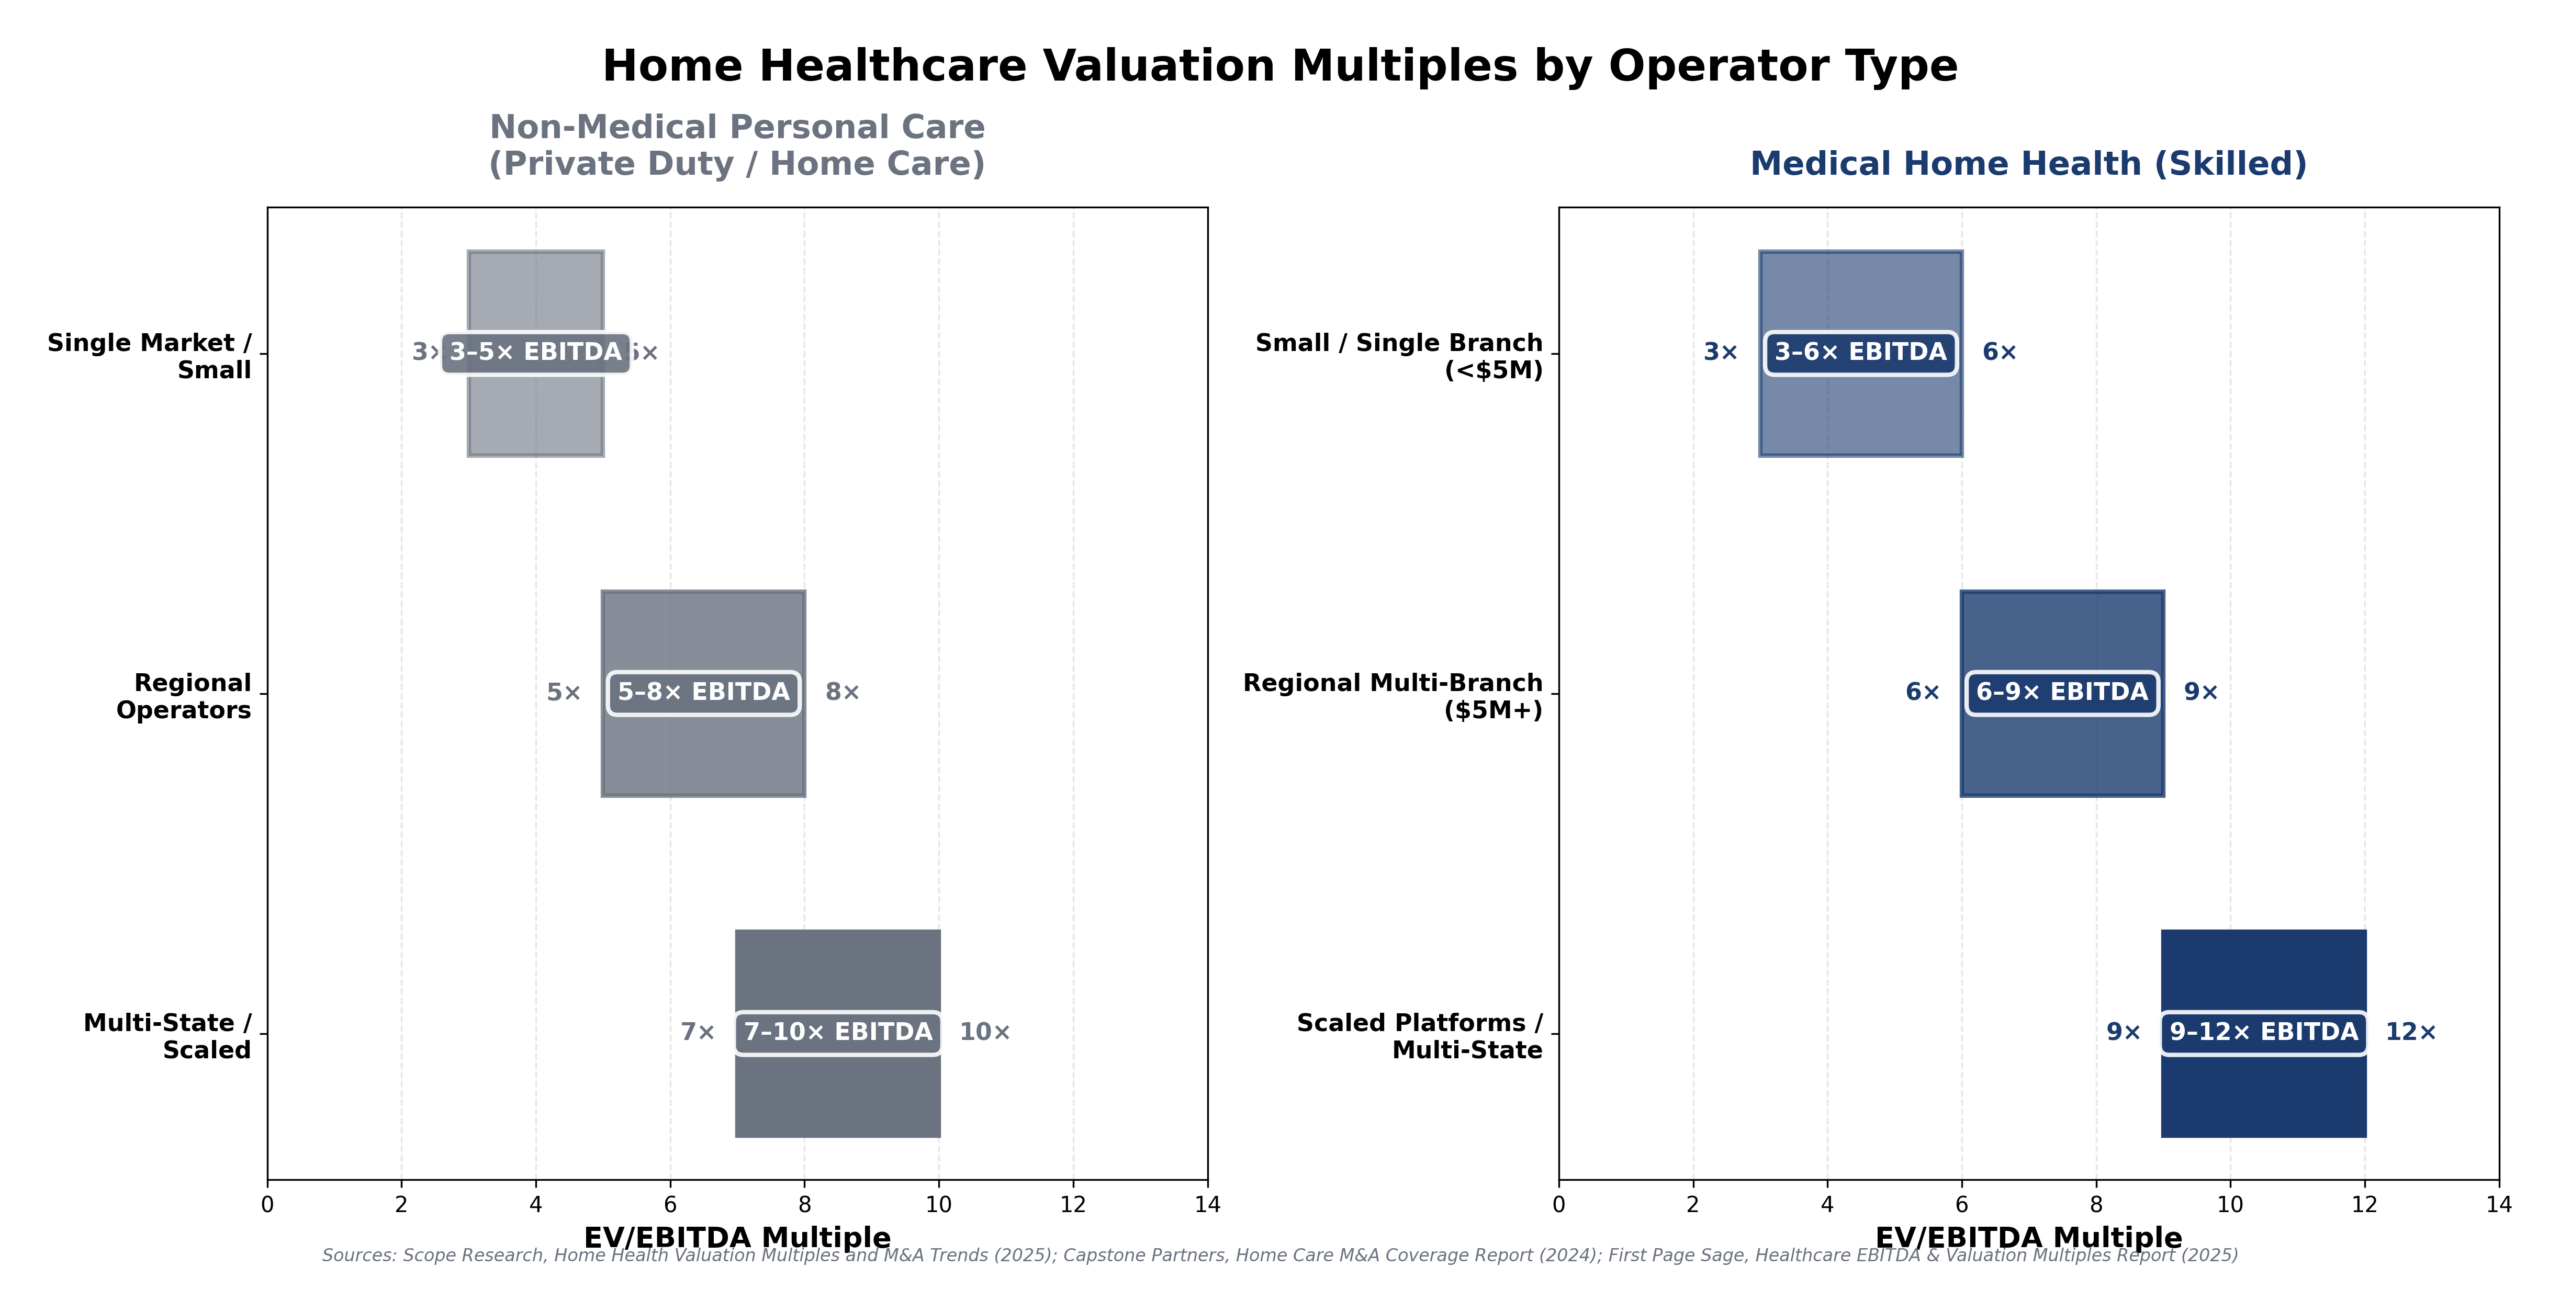
For small agencies, valuations remain heavily tied to owner involvement and census stability. Once agencies reach meaningful scale and demonstrate predictable referral channels, EBITDA multiples expand significantly. This table connects directly to underwriting reality and provides the valuation framework used throughout the market.
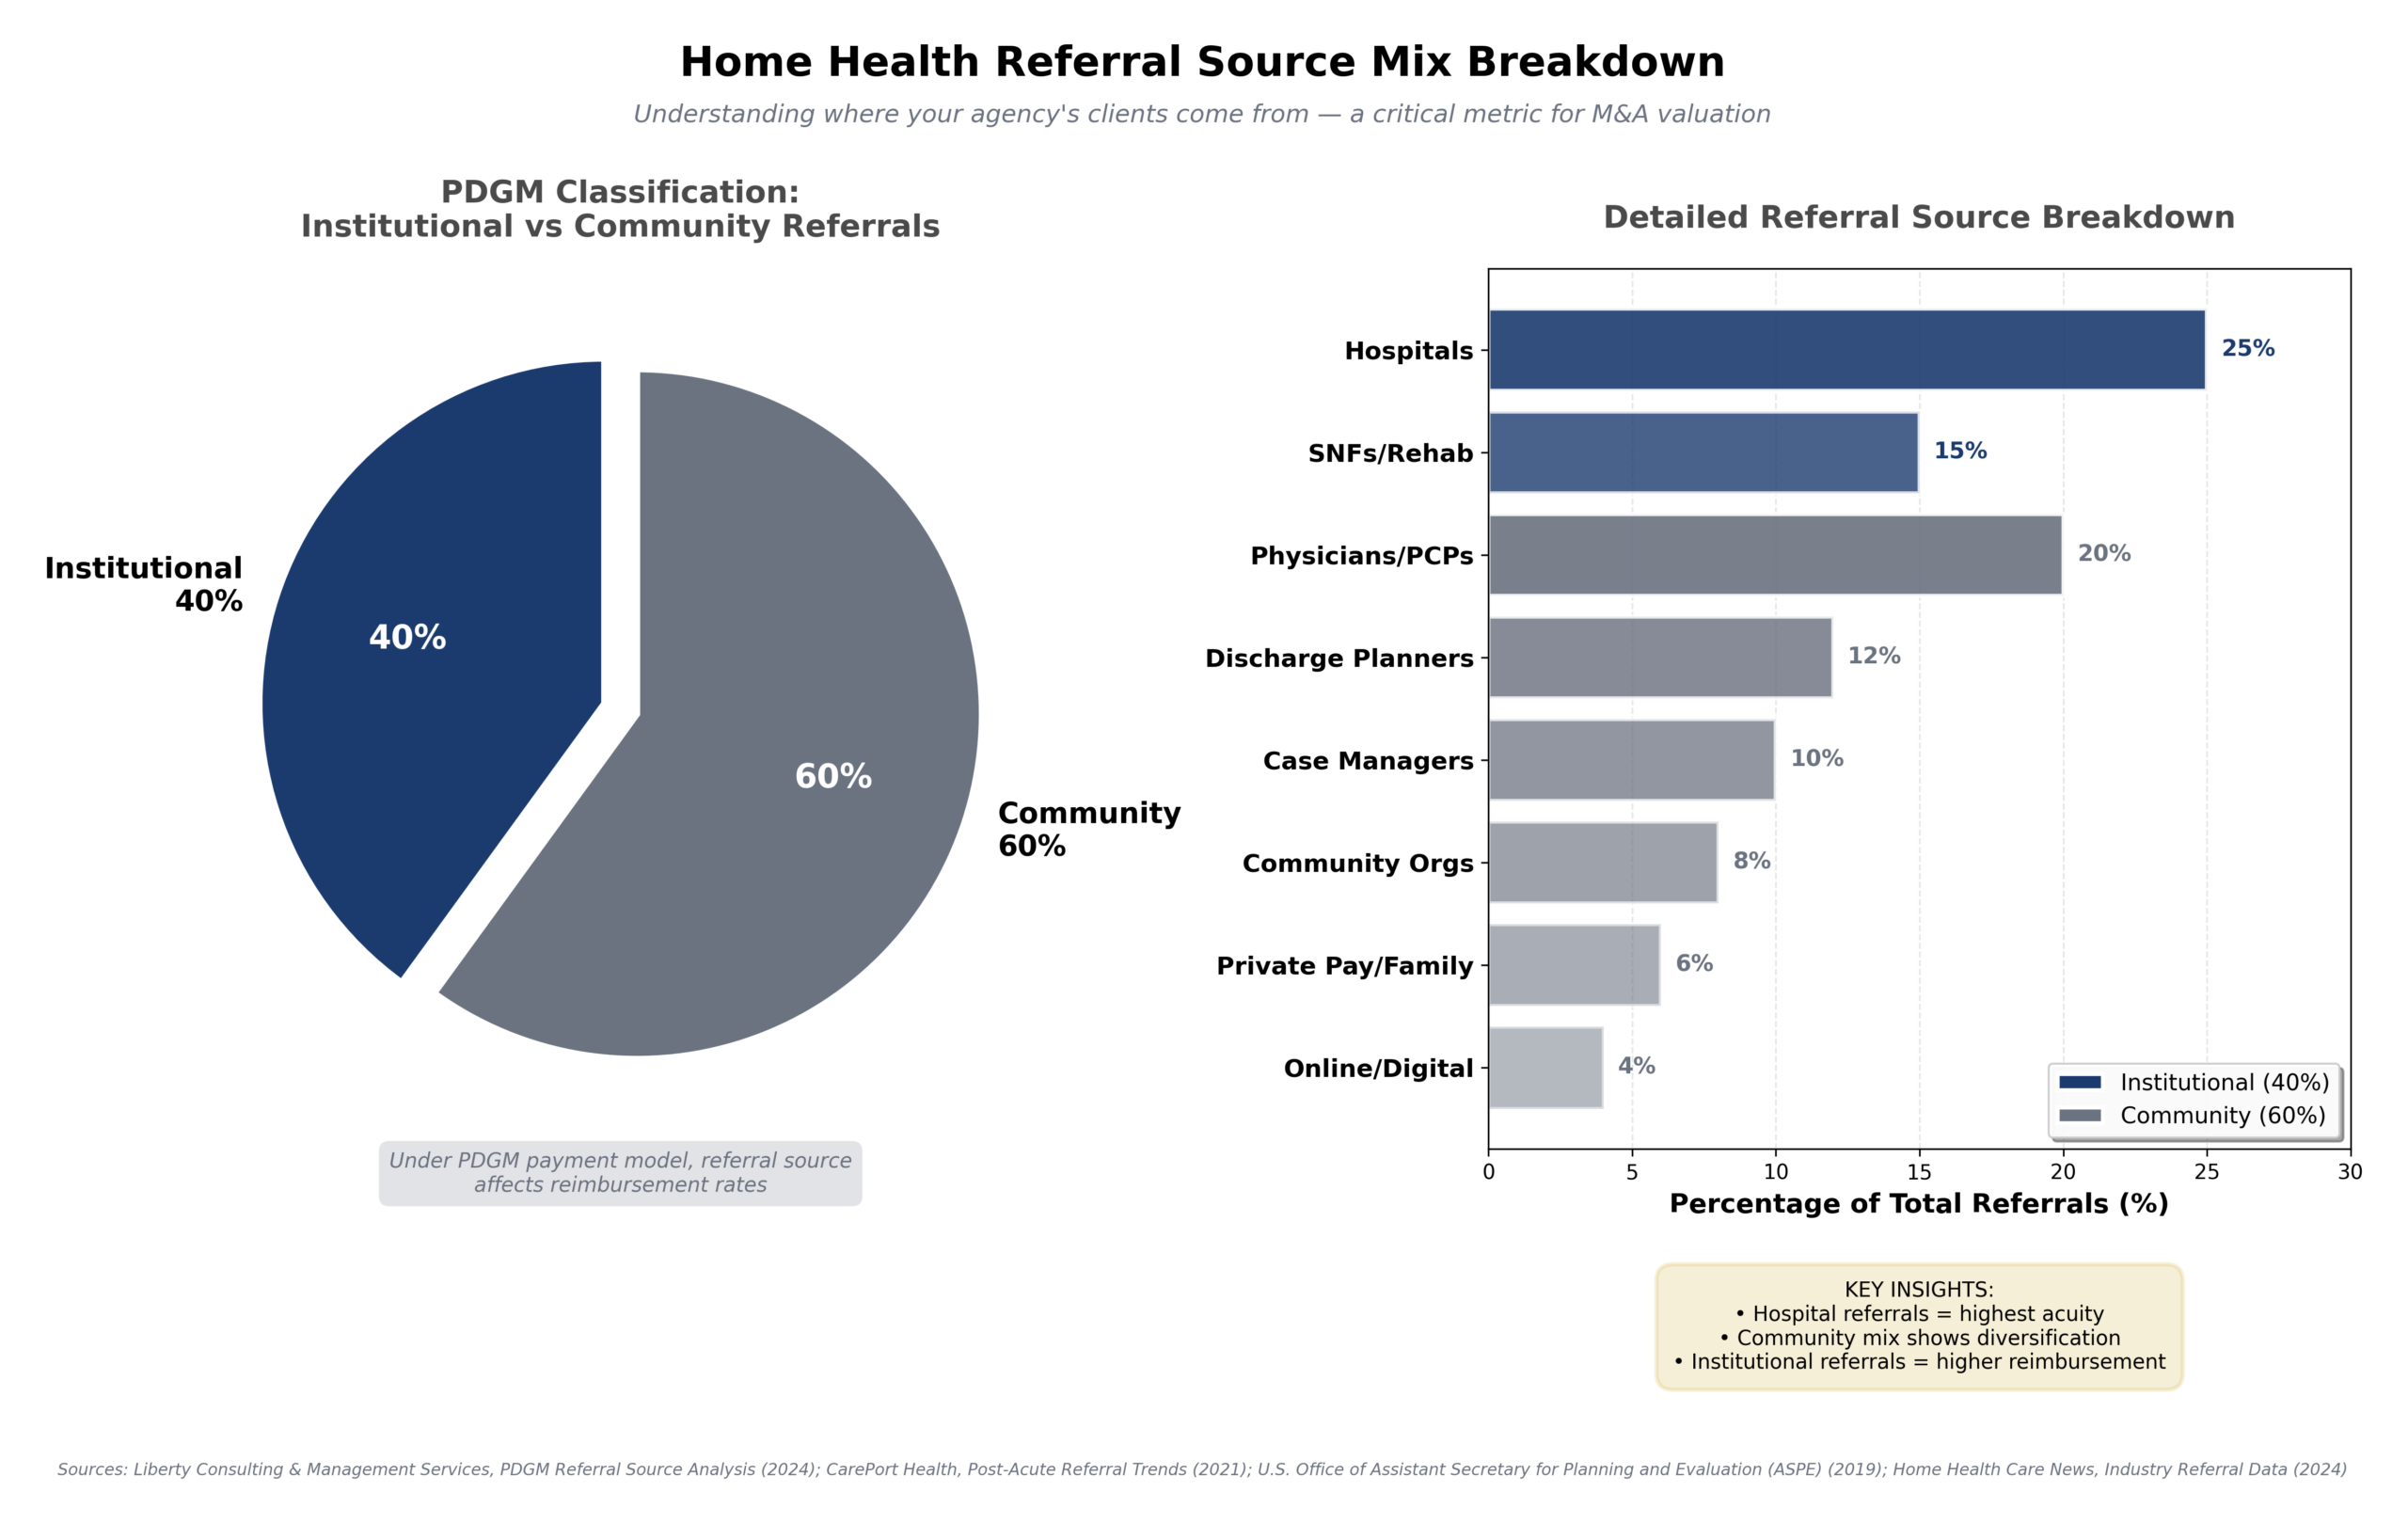
Referral source composition is a major driver of both reimbursement and valuation in home health. The chart below breaks down the typical mix of institutional vs. community referrals and highlights which channels contribute most to patient acquisition under the PDGM model:
A growing and stable census is one of the most important KPIs for buyers. Key areas of focus include:
Declining or inconsistent census trends often result in material valuation discounts.
Caregiver recruitment and retention represent perhaps the single largest operational challenge in the sector. Buyers evaluate:
Agencies with stable caregiver rosters and low turnover command premium multiples due to reduced client attrition and service disruption risk.
Businesses heavily dependent on the owner—for scheduling, recruiting, compliance, or referral maintenance—typically receive valuation discounts of 0.5–1.0× SDE.
Institutional buyers tend to favor agencies with:
Licenses and accreditations meaningfully impact valuation:
The sector is undergoing a notable modernization cycle as agencies adopt:
Operators that successfully integrate technology often outperform peers in efficiency, margin control, and survey readiness.
The following chart illustrates the evolution of technology adoption from 2015 to 2025, showing how modernization has progressed in distinct phases and how COVID-19 acted as an inflection point for virtual care and remote patient monitoring. Operators that invest in technology consistently demonstrate stronger efficiency, better compliance, and improved caregiver retention—key drivers of valuation:

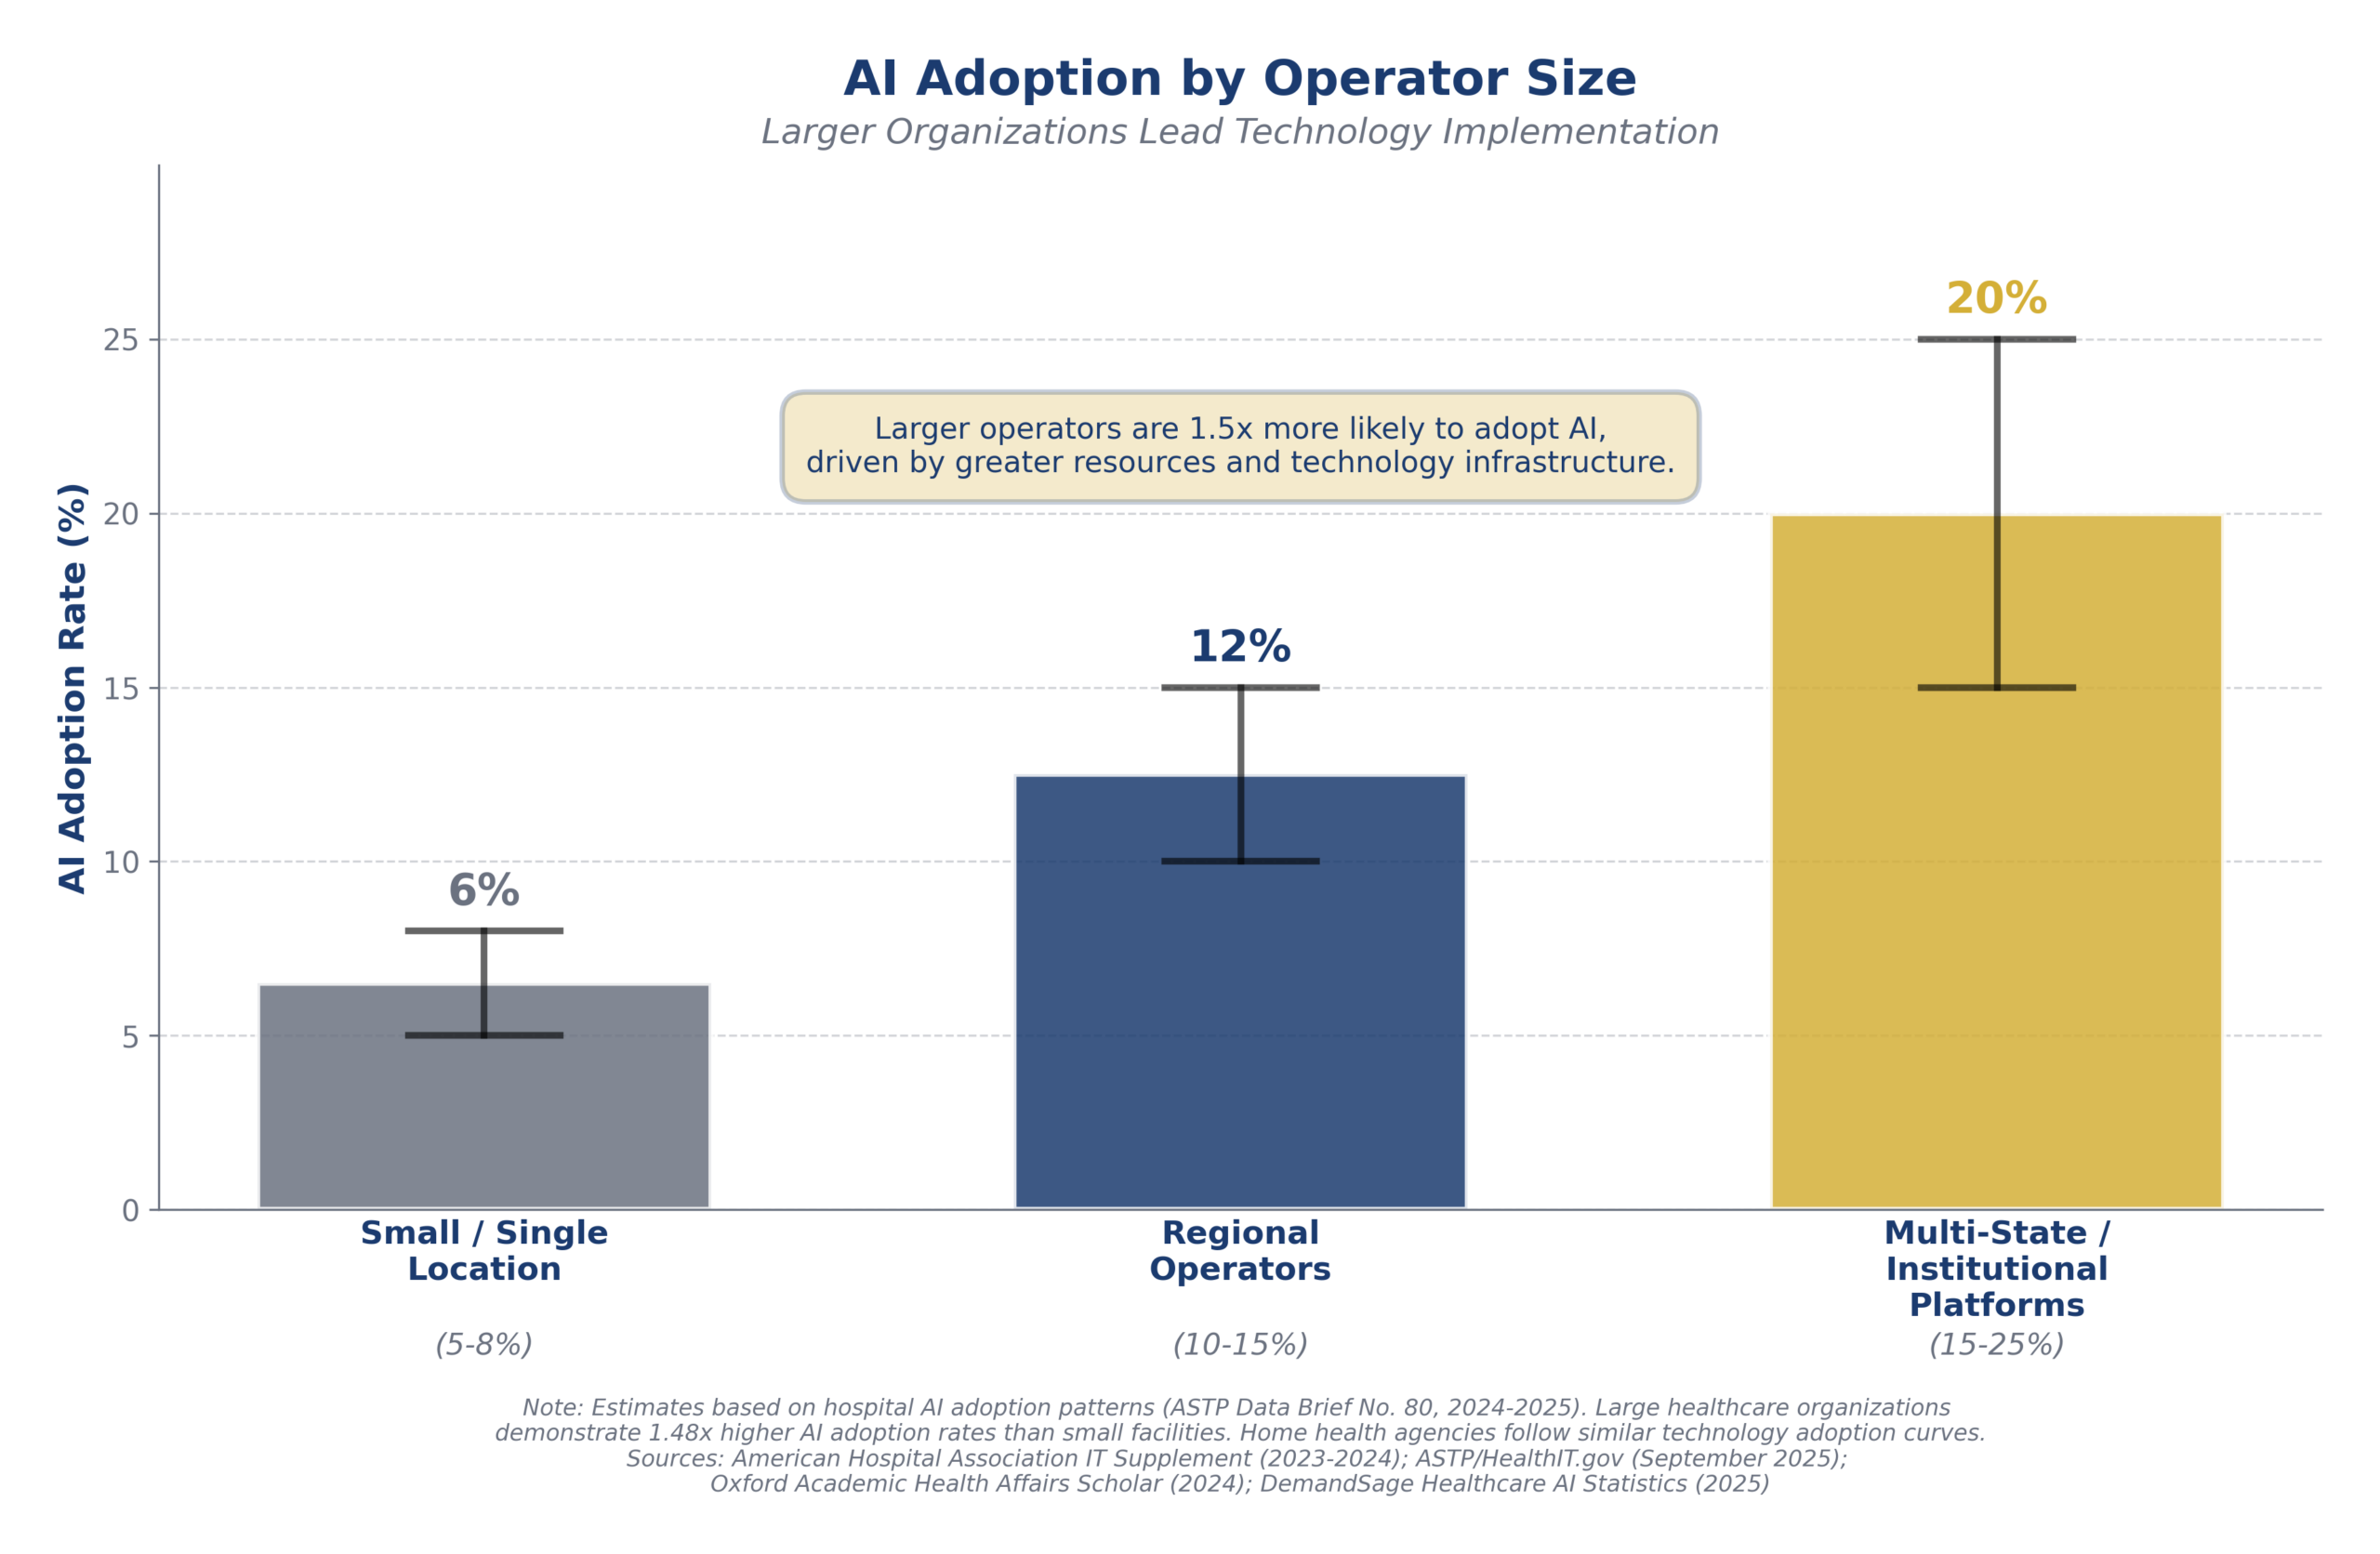
Technology adoption in home health care is increasingly driven by scale. Larger operators are adopting AI-enabled tools at materially higher rates, leveraging automation and data analytics to improve efficiency, compliance, and workforce management. Smaller agencies, constrained by limited resources, face growing competitive pressure as technology-enabled platforms widen the operational gap. The chart below highlights the disparity in AI adoption by operator size:
As a result, many sub-scale agencies have begun partnering with, affiliating with, or selling to larger organizations that can provide centralized technology infrastructure, administrative support, and operational resources. These partnerships allow smaller operators to remain competitive in an environment where technology-enabled care delivery, compliance, and workforce management are becoming table stakes rather than differentiators. Buyers and institutional platforms increasingly favor businesses that can either demonstrate strong internal technology adoption or leverage the scale and resources of a larger organization to compete effectively in this evolving landscape.
Private equity investment in the sector continues to increase as firms seek scalable platforms with:
Well-run platforms with $5M+ EBITDA can, in some cases, achieve double-digit EBITDA multiples.
Even as demand expands, caregiver supply remains constrained. Leading agencies differentiate with:
Federal and state initiatives continue to support home-based care through:
These programs increase long-term demand tailwinds but also introduce additional compliance and reporting complexity.
The majority of sub-$10M transactions in this sector are financed via SBA 7(a) structures:
Standard SBA amortization is 10 years, with interest rates generally structured as Prime plus 1.5–2.5%, in a mix of fixed and floating arrangements. Lenders generally prefer buyers with healthcare or services experience, familiarity with hourly labor management, and a solid understanding of regulatory compliance.
While seller financing remains common, its necessity is decreasing in competitive processes. Buyers still value seller participation as a sign of confidence and as an additional source of leverage in negotiations.
Transactions exceeding approximately $10 million in enterprise value are generally financed through institutional capital structures rather than SBA-backed facilities. Buyers in this segment are typically private equity funds, family offices, and strategic acquirers seeking scalable platform investments.
Financing structures at this level are driven primarily by cash flow and balance sheet strength rather than purchase price percentages and often include:
These transactions favor operators with professionalized management teams, diversified referral sources, multi-location or multi-state footprints, and demonstrated ability to integrate technology and regulatory infrastructure. While valuations may be higher at this level, access to institutional buyers typically requires scale, operational maturity, and reduced owner dependence.
The Home Health Care and Personal Care Services sector is positioned for continued long-term expansion driven by demographic necessity and payer preference for lower-cost, home-based models. While the regulatory environment remains complex and labor markets are tight, the sector’s fundamental growth profile and consolidation dynamics, increasingly shaped by rising technology and AI-driven operational requirements, create a compelling landscape for owners considering a sale.
Sophisticated, professionally managed agencies with demonstrable earnings quality, diversified referral sources, stable staffing, and robust compliance infrastructure are achieving the highest valuations in the sector’s history. For many owners, the ideal window to maximize value is now—before increased regulatory pressures and rising labor costs create further margin compression that may disadvantage smaller, more owner-dependent operators.